
 ▶
▶





 ▶
▶Real Estate Agent Transaction + Commission Tracker
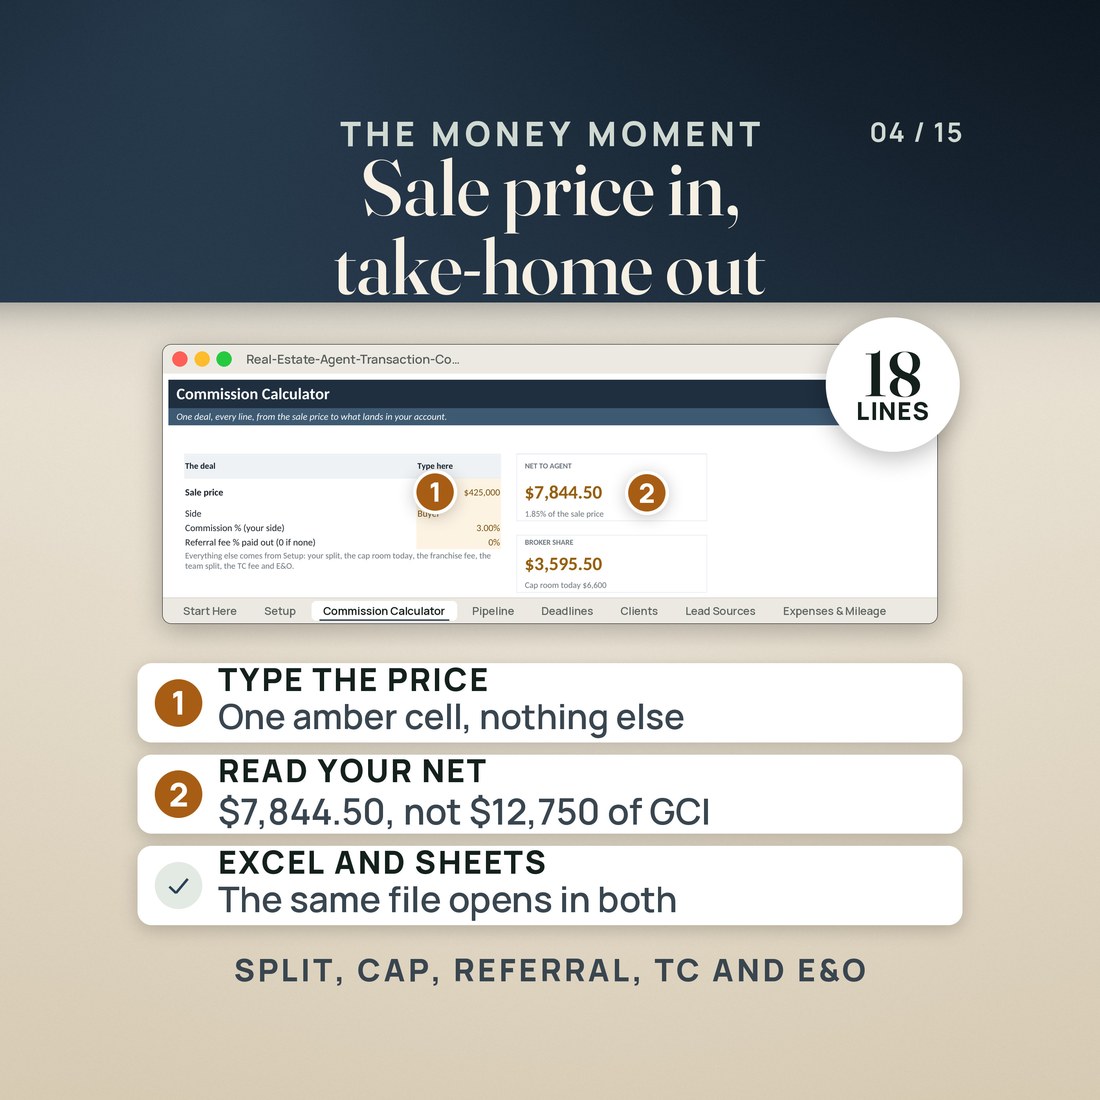
Type a sale price and the eighteen line walk answers with net to agent, after the split, the cap, the franchise fee, the coordinator and E and O. Fifty deals, eighty clients, one file.
You know the sale price and you know your side of the commission. What you do not know, until the disbursement comes back, is what lands in your account.
- The whole commission chain on one screen: eighteen lines from the sale price to what the brokerage keeps, ending at net to agent and the effective percentage of the sale price
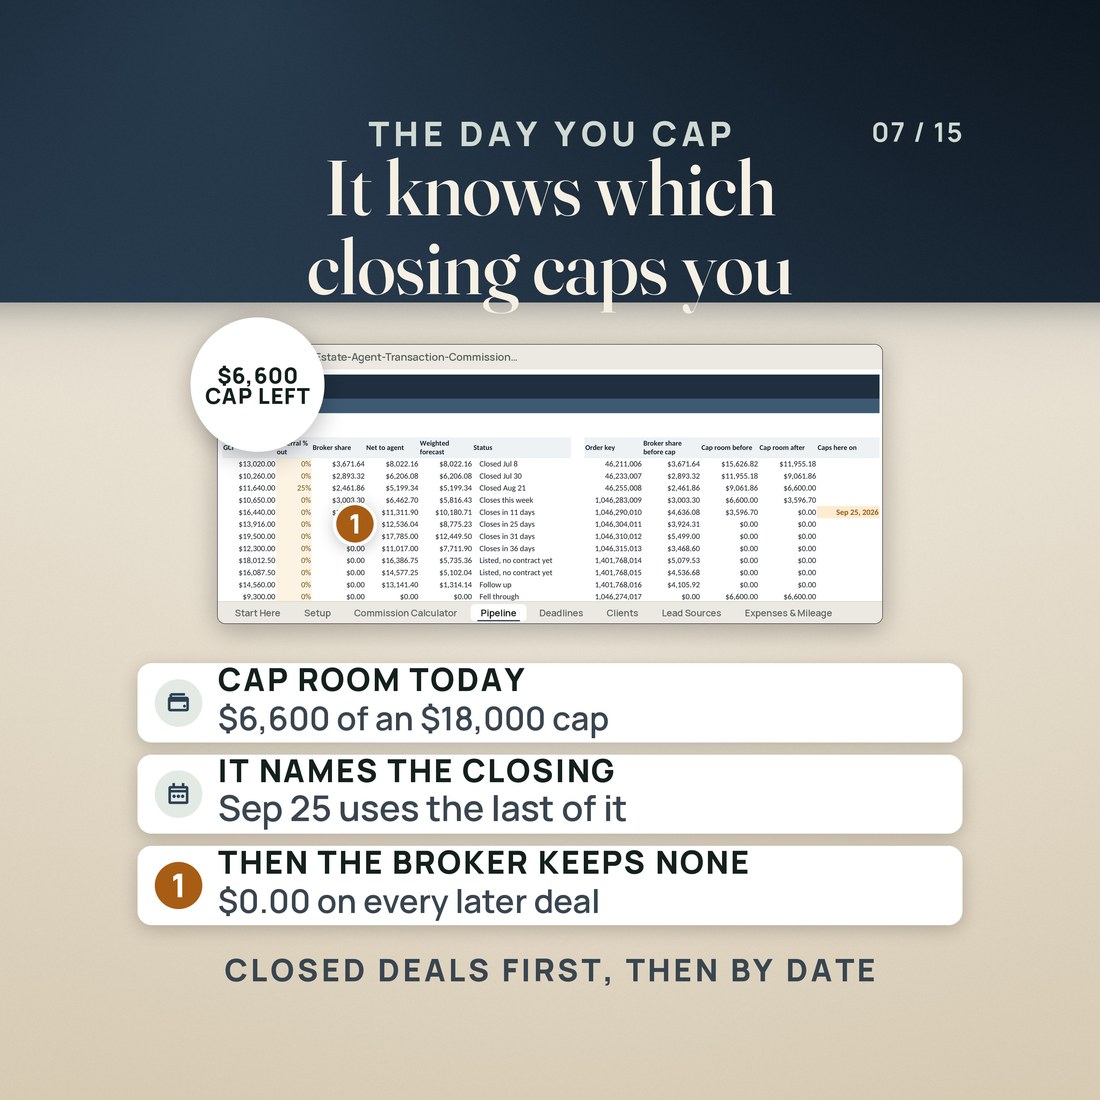
- A cap that actually binds. The sample $18,000 cap holds $15,626.82 of room once what was already paid this year is counted, three closed deals use $9,026.82 of it, $6,600 is left, and the file names the Sep 25 closing that takes the last of it. Every deal closing after that shows a broker share of $0.00
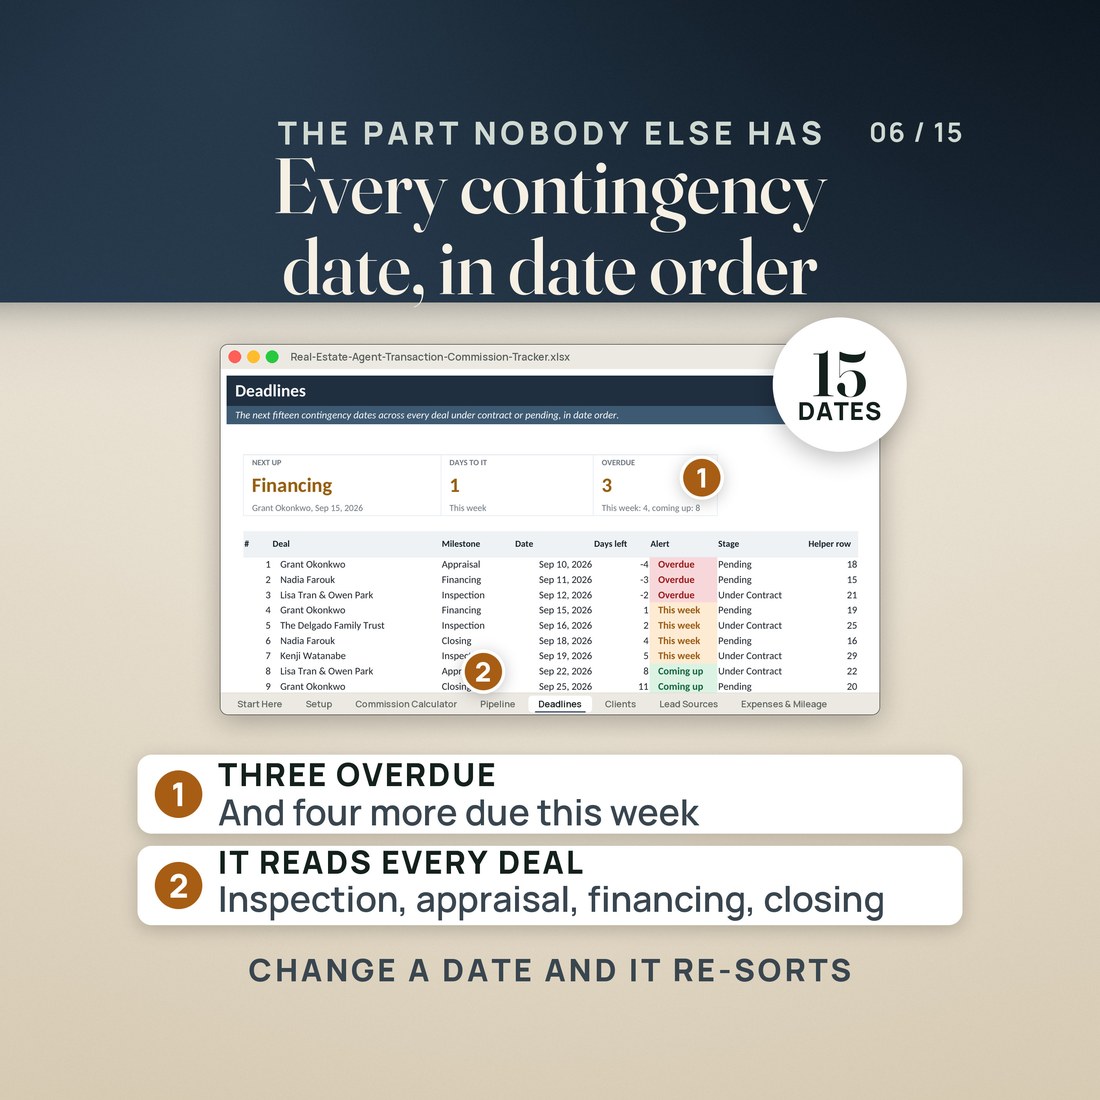
- A deadline calendar that reads every contingency date in the pipeline: fifty deals by four milestones (inspection, appraisal, financing, closing) sorted into overdue, due this week and coming up. The sample has seventeen dates inside the window and lists the next fifteen
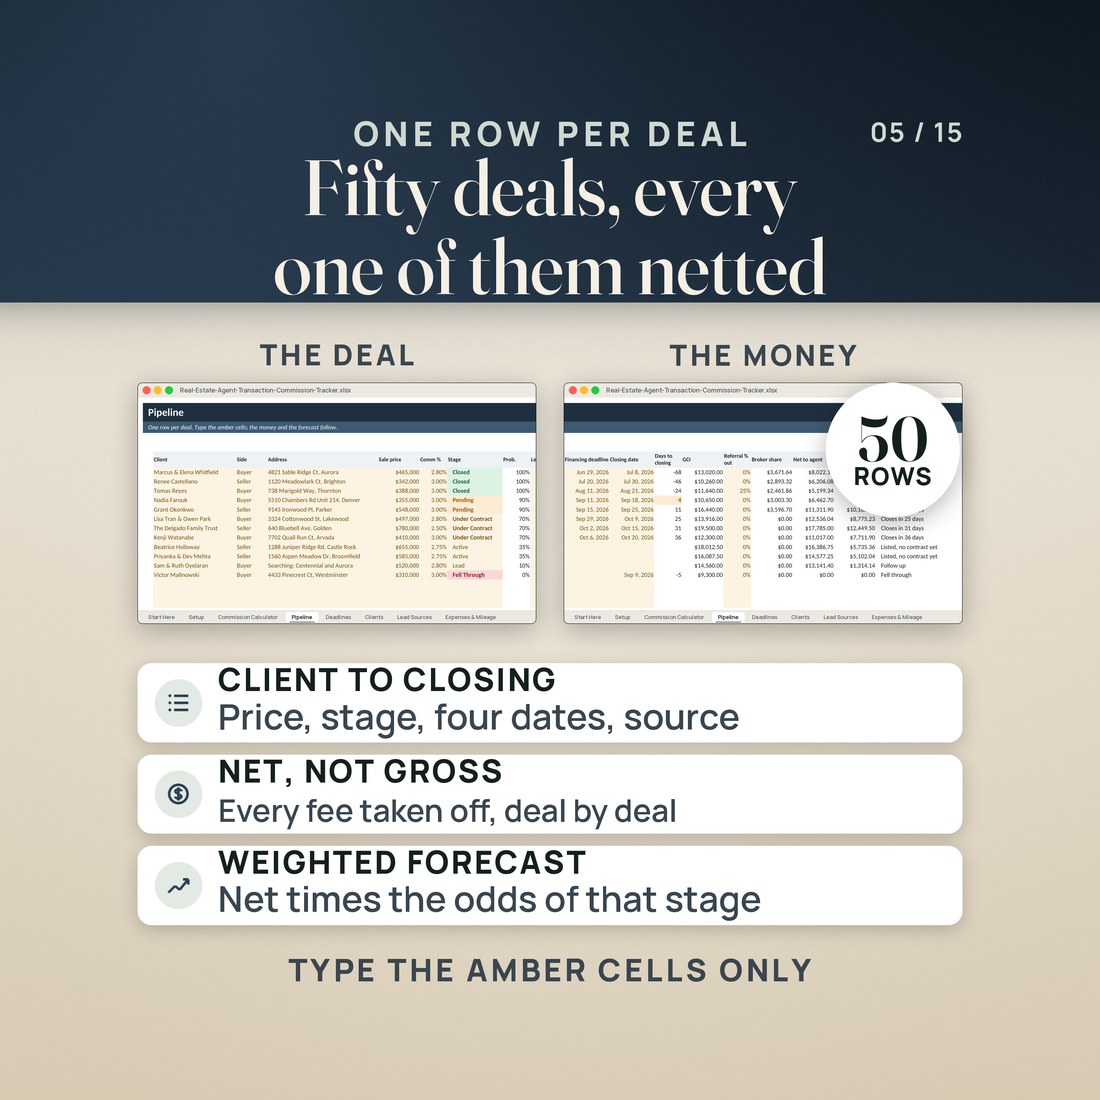
- Fifty deal rows with a probability-weighted forecast by stage, and a five column cap engine that charges each deal in closing order
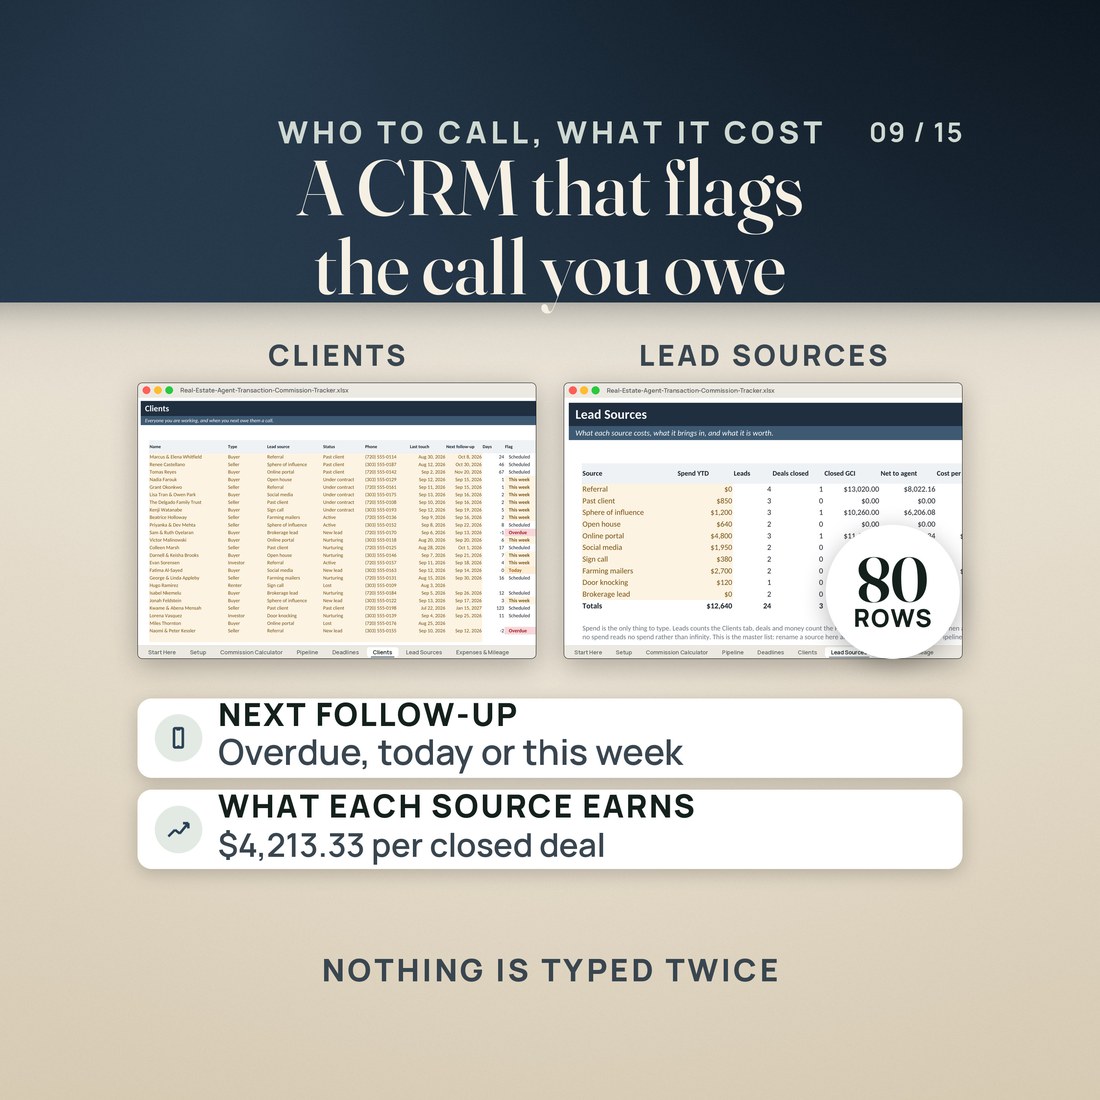
- Eighty CRM rows with client type, lead source, status, the last touch, the next follow-up, the days until it is due and a flag when it is late
- Ten lead sources costed down to cost per lead, cost per closed deal and return on spend, with the open weighted pipeline each source is carrying
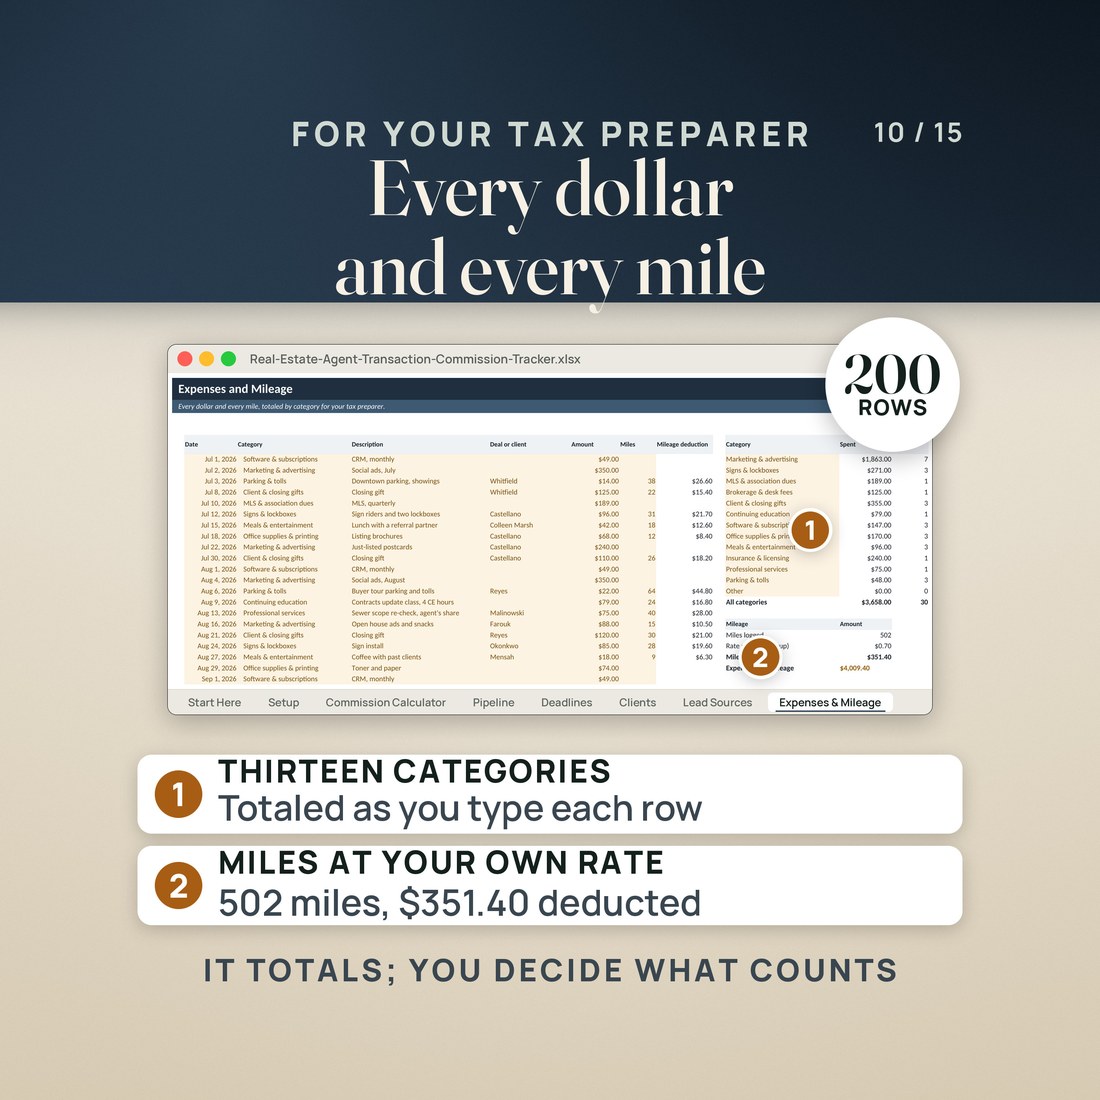
- Two hundred expense rows across thirteen categories with miles and the mileage deduction, added together in one block
- 2,088 formulas in every edition, recalculated with zero errors, working in both Excel and Google Sheets. Four color editions, no macros, no subscription, no account
Overview
Type a sale price and the eighteen line walk answers with net to agent, after the split, the cap, the franchise fee, the coordinator and E and O. Fifty deals, eighty clients, one file.
You know the sale price and you know your side of the commission. What you do not know, until the disbursement comes back, is what lands in your account.
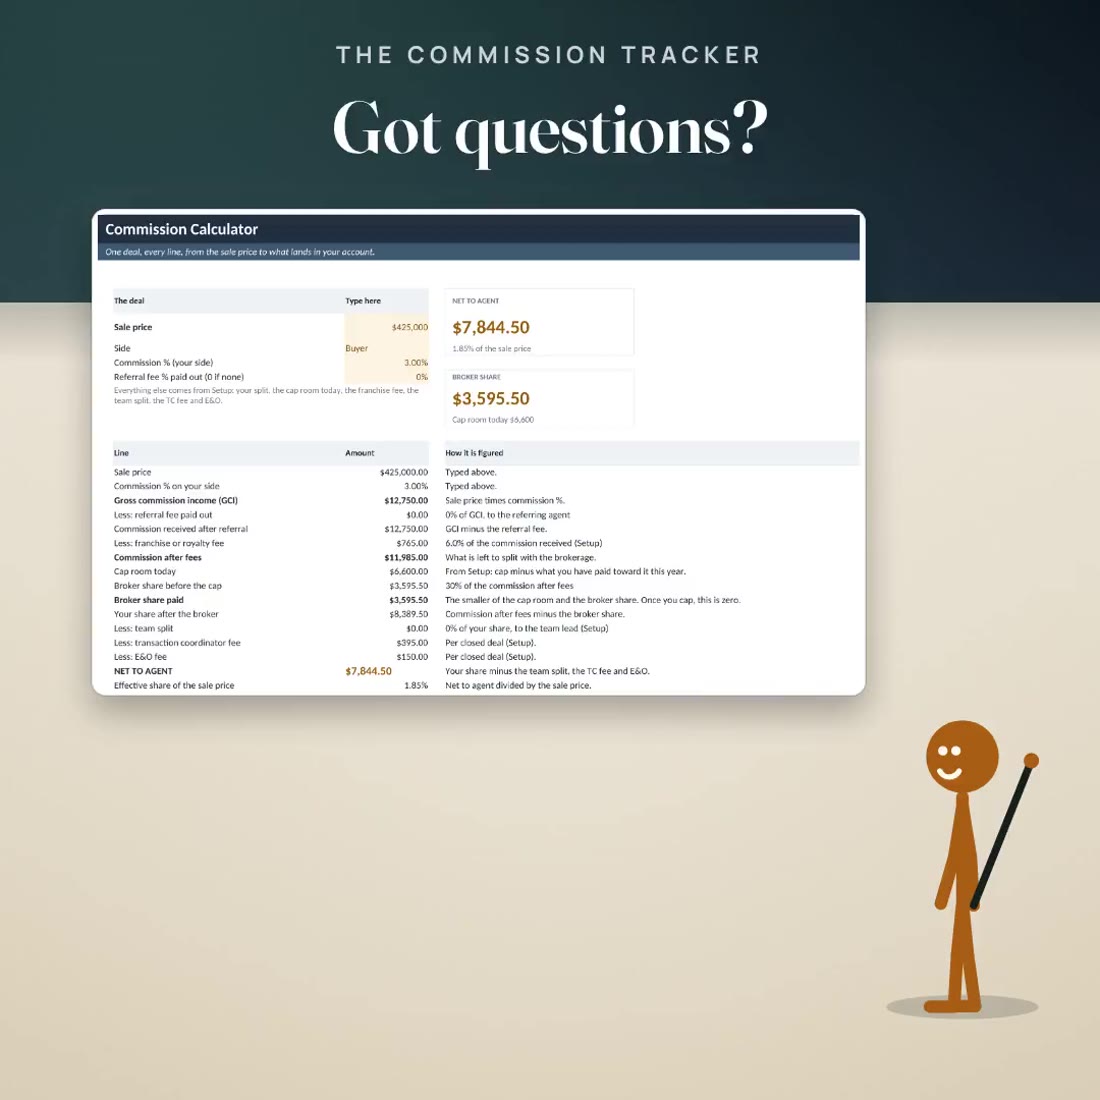
The sample this file opens with is an agent on a 70/30 split with an $18,000 annual cap. A $425,000 sale at 3% is $12,750 of gross commission, and after a $765 franchise fee, a $3,595.50 broker share, a $395 transaction coordinator fee and $150 of E and O, she keeps $7,844.50. That is 1.85% of the sale price, and every line between the two figures is on the same screen. Type $450,000 instead and the net reads $8,338.00, still 1.85%.
What's Included
One ZIP, 6 files:
- One ZIP holding the Real Estate Agent Transaction and Commission Tracker as a single .xlsx workbook in four color editions: Colorful and Editorial loose, Light and Dark inside a small 3color zip beside them
- Ten tabs: Start Here, Setup, Commission Calculator, Pipeline, Deadlines, Clients, Lead Sources, Expenses and Mileage, Dashboard and Help
- A worked sample of an invented agent, Priya Anand of Anand Realty Group at Summit Brokerage, with twelve deals already typed in so nothing opens blank
- A two page Quick-Start PDF and a START-HERE file with the four things to do first and the honest warnings
Key Benefits
Why this one
Gross commission is not income. Eighteen lines run from the sale price through the referral fee out, the franchise or royalty fee, the broker split, the team split, the coordinator fee and E and O, and land on net to agent with the effective percentage of the sale price beside it.
Most trackers let you type a cap and then ignore it. This one charges every deal in closing order, keeps a running cap room column, names the closing date you cap on, and shows a broker share of $0.00 on every deal after it.
Inspection, appraisal, financing and closing across fifty deals is two hundred dates in four places. Deadlines reads all of them, sorts them into overdue, due this week and coming up, and puts the days left on each.
Ten lead sources with spend, leads, deals closed, closed commission, net to agent, cost per lead, cost per closed deal and return on spend, with the open weighted pipeline each one is still carrying.
The Commission Calculator assumes the deal you are typing closes next, so it uses the cap room you have today. The Pipeline puts that same deal in closing order behind everything ahead of it. Both are right to different questions, and the Help tab says so.
Who It's For
Built for
- A licensed agent on a split with a cap who wants to know what a closing actually pays after the brokerage, the franchise fee, the coordinator and E and O, and which closing takes the last of the cap room
- An agent running five or ten deals at once whose inspection, appraisal, financing and closing dates live in four different places
- An agent who already keeps the business in a spreadsheet and wants the pipeline, the client list, lead source spend and the mileage log in the same file as the commission math, with no subscription and no account
- A new agent who has just signed an independent contractor agreement and wants to see, before the first closing, what the split and the cap really cost
How It Works
Up and running in minutes
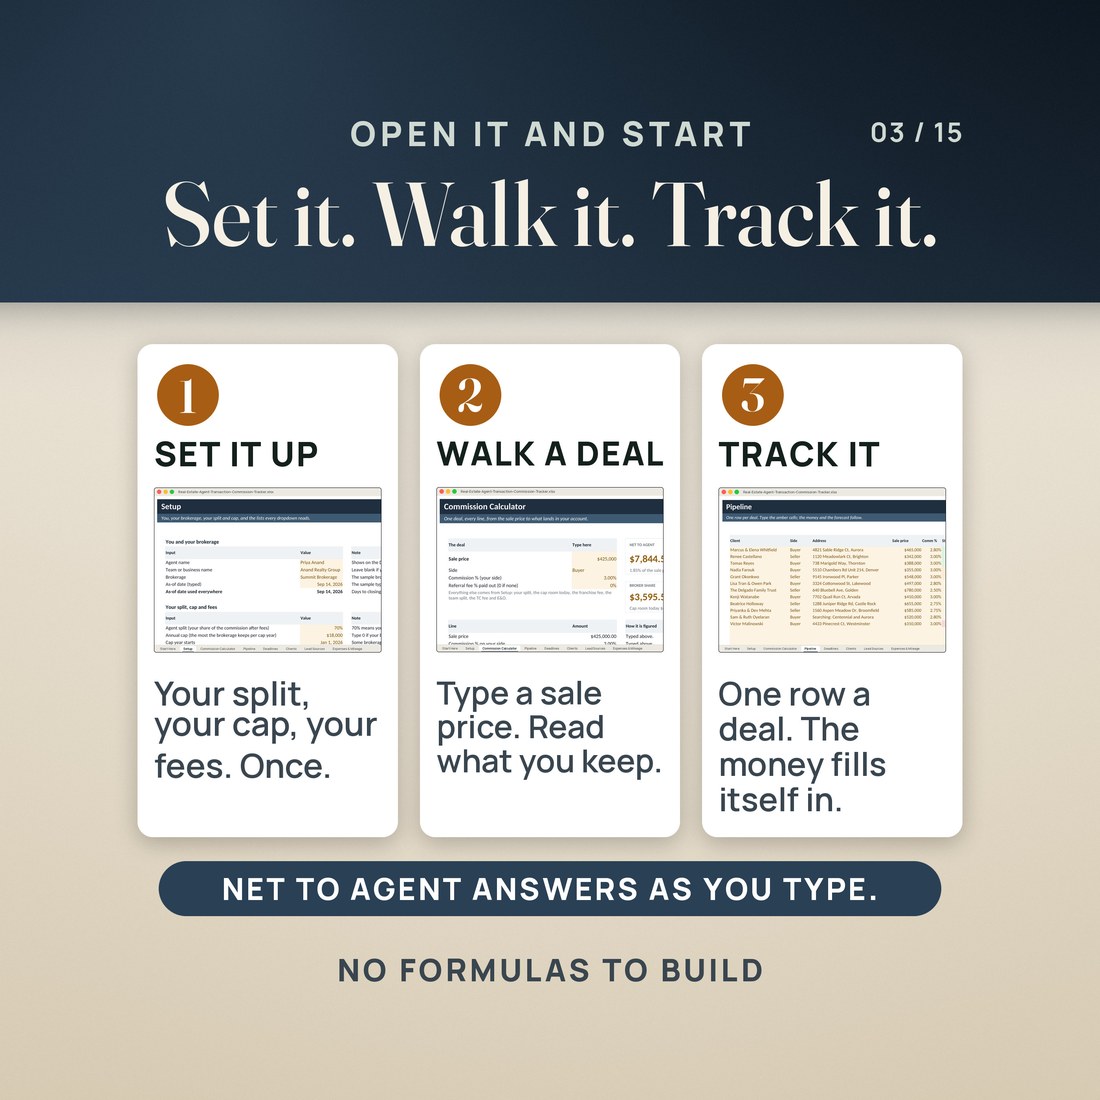
On Setup: your split, your annual cap and the date your cap year starts, what you have already paid toward it, the franchise or royalty percentage, the coordinator fee, the E and O fee per closed deal, your team split and the mileage rate. Type 0 for anything you do not pay.
Commission Calculator takes four amber cells, the sale price, the side, the commission percentage and any referral paid out, and returns the eighteen line walk to net to agent with the cap room left afterward.
Type your deals with their contract, inspection, appraisal, financing and closing dates. The cap engine charges each in closing order and Deadlines lists the next fifteen dates across the whole book.
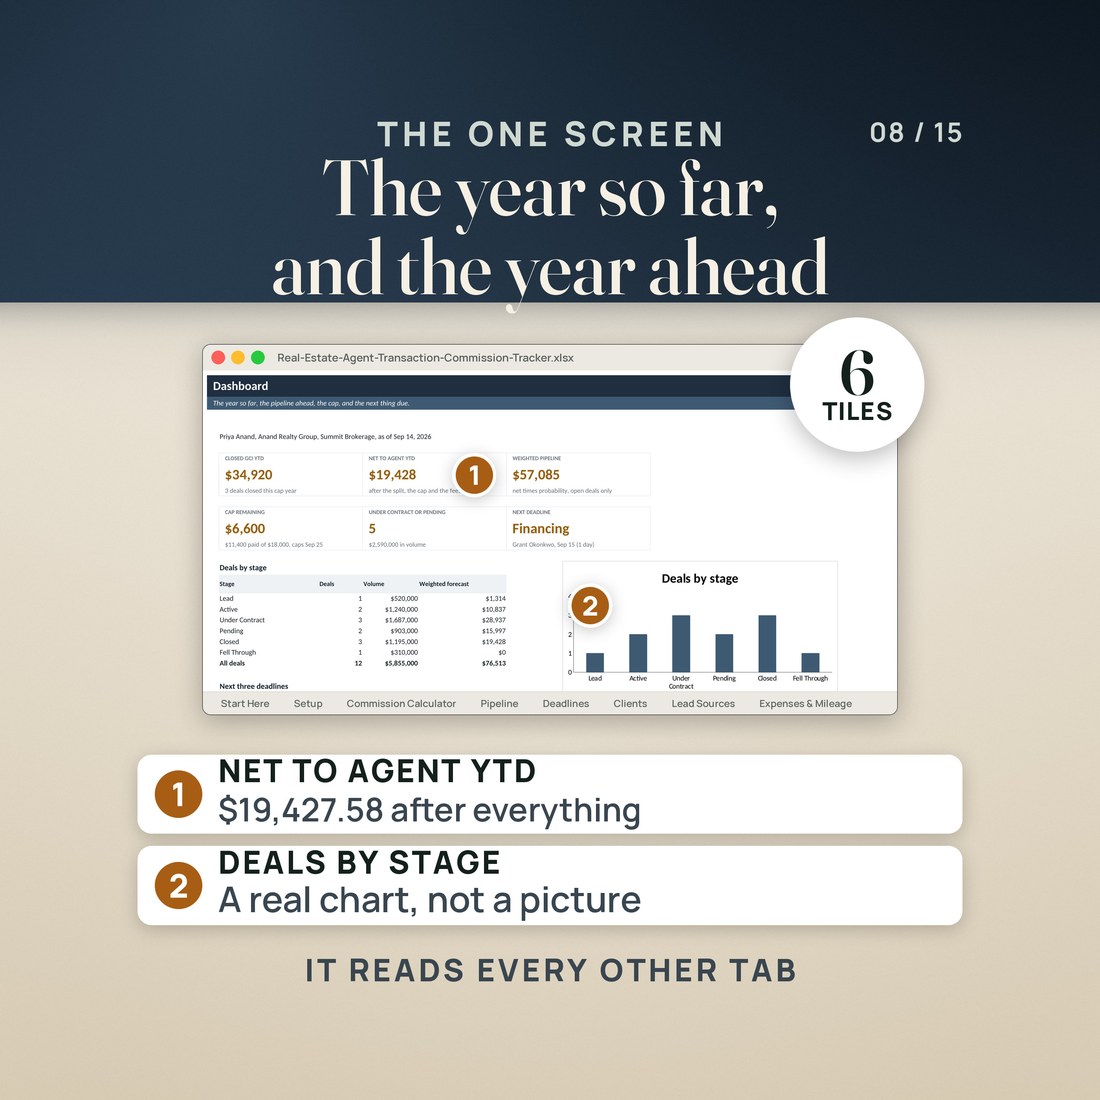
Six tiles, deals by stage with a bar chart, the next three deadlines and eight business measures, with the client follow-ups, the lead source returns and the mileage deduction a tab away.
Why It's Different
Not another template
Page one of this lane is a pipeline list with a commission column, and the commission column is a single multiplication. The money an agent keeps is not one multiplication and never has been: it is a chain, and the split changes partway through the year because of the cap. This file writes the chain out in eighteen lines you can read, then makes the cap binding across the whole pipeline, charging every deal in closing order and naming the closing that takes the last of the room. It is also honest about the edges. The cap here is a per-deal simplification, real brokerages add fees this file has no cell for, and the Help tab tells you to check one closed deal against your own commission disbursement authorization before you quote a number to anyone.
Delivery & Compatibility
Instant, and it opens in what you already use
As soon as your order is complete you get instant access to download the ZIP: the workbook in four color editions, a two page Quick-Start PDF and a START-HERE file. Nothing ships and nothing installs.
One ZIP, instant download. Built for Excel 2016 or later and tested in LibreOffice Calc; for Google Sheets choose File, Import, Upload, then Replace spreadsheet. Every formula ships with its value saved, so the sample shows up in protected view, in the Sheets preview and on a phone instead of blanks. Apple Numbers opens the file but drops some formatting. No macros, no add-ons, no account and no subscription.
FAQ
Questions, answered
What format is this?
One workbook (.xlsx) in four color editions, Colorful, Editorial, Light and Dark, plus a two page Quick-Start PDF and a plain text START-HERE file. You get a ZIP to download the moment payment clears.
What do I need to open it?
Excel 2016 or later, or Google Sheets (File, Import, Upload, then Replace spreadsheet), on a computer or through the Excel or Sheets app on a phone or tablet. It was tested in LibreOffice Calc as well. There are no macros and nothing to install.
What does it compute?
Net to agent on one deal line by line, and across the pipeline the broker share deal by deal in closing order, the cap room before and after each one and the closing date you cap on, the days to closing and a status for every deal, a probability-weighted forecast by stage, every contingency date sorted into overdue, this week and coming up, the days until each client follow-up, cost per lead and cost per closed deal and return on spend for each source, and the expense total by category with the mileage deduction.
Will it match my brokerage exactly?
Not on its own. Every brokerage writes its own split, cap and fee schedule, and yours comes from your independent contractor agreement. The cap here is a per-deal simplification, so check one closed deal against your own commission disbursement authorization before you quote a number to anyone, and fold anything left over into the paid-toward-the-cap figure on Setup.
Does it connect to the MLS?
No. Nothing here connects to the MLS or to a brokerage transaction system, and nothing emails your clients. It is a spreadsheet: you type the deals, it does the arithmetic.
Is this tax or legal advice?
No. It is a tracker. Expenses and Mileage totals what you spent, it does not decide what is deductible, and the IRS standard mileage rate is a cell you retype each January. Priya Anand, Summit Brokerage and every client, address and figure in the sample were invented for the example.
This is a tracker, not tax, legal or brokerage advice. The cap logic is a per-deal simplification, one annual cap charged deal by deal in closing order with closed deals first; real brokerages add things this file has no cell for, such as a post-cap transaction fee, a desk fee that also counts toward the cap, a company dollar minimum, or a split that steps up partway through the year. Deadlines lists only deals at Under Contract or Pending and only four milestones. Two deals closing the same day are charged top to bottom as they sit on the Pipeline, and a deal with no closing date is assumed to close last. The Pipeline totals row is a raw column sum, so the Dashboard figures are the ones to quote. One cap year and one agent per file. Fifty deals, eighty clients, two hundred expense rows and fifteen listed deadlines are the limits, and the four color editions are separate files. Every name and figure in the sample was invented for the example. Digital product; because the files are delivered instantly, all sales are final.


