 ▶
▶



 ▶
▶Retirement Income + Can I Retire Planner
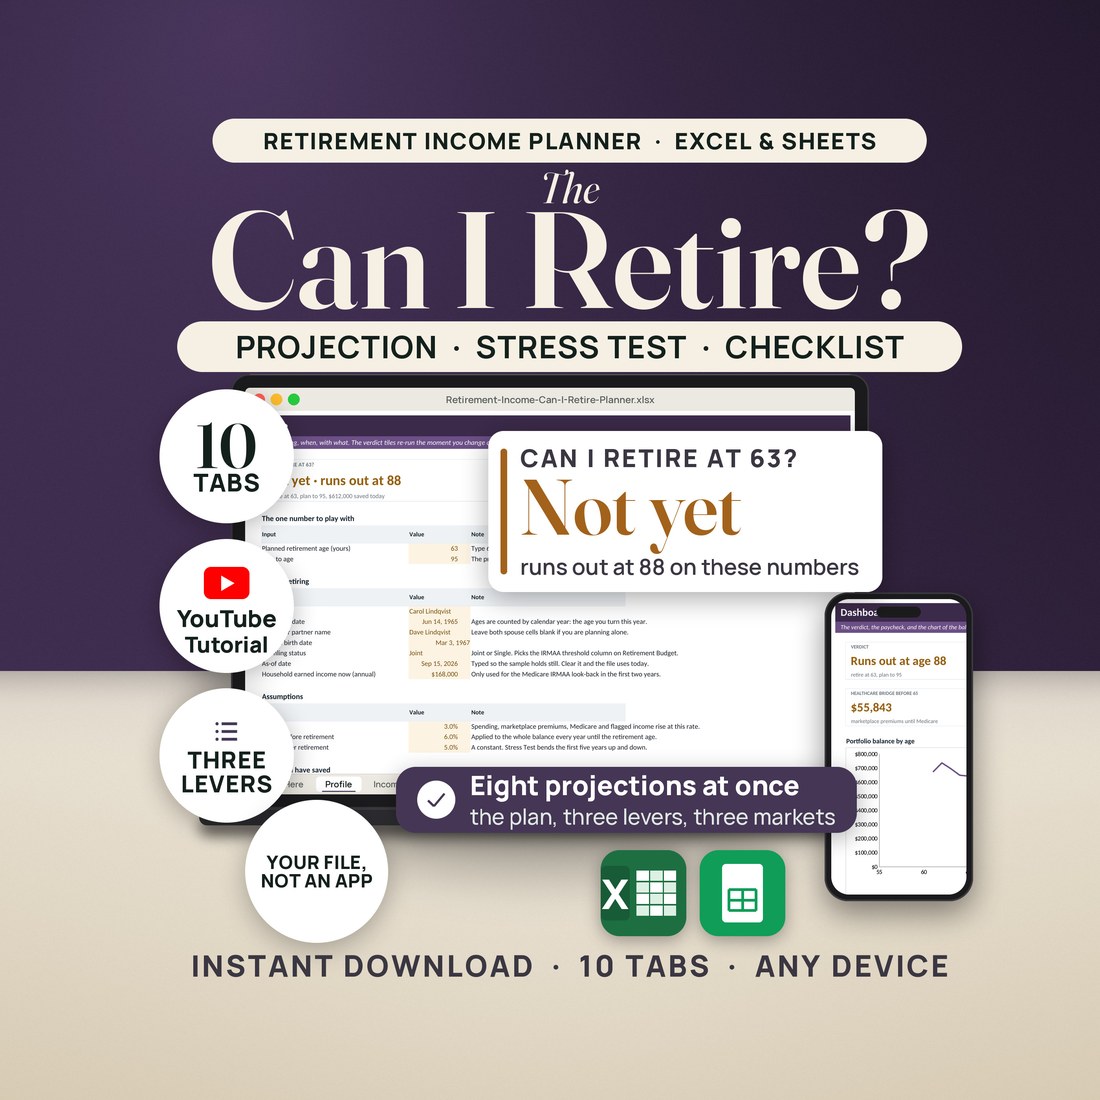
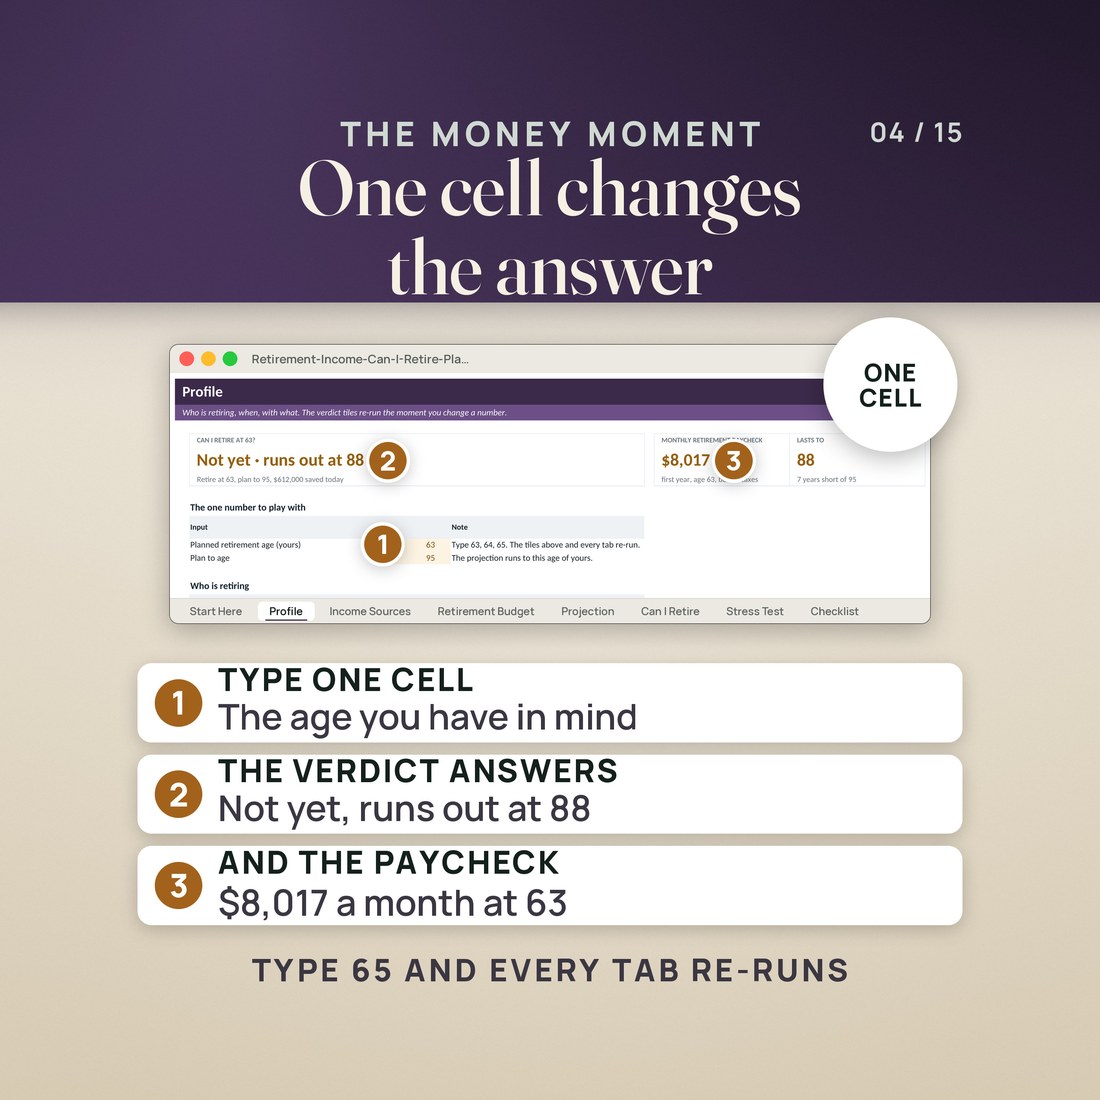
Type the age you have in mind and the file answers in one line: yes or not yet, the age the money runs out, and the monthly retirement paycheck. Then it shows you what to change.
You have a number saved and an age in mind, and nothing that puts the two together. A readiness score out of 100 does not tell you what to change, and neither does a black box that runs a thousand simulations and hands back one probability of success.
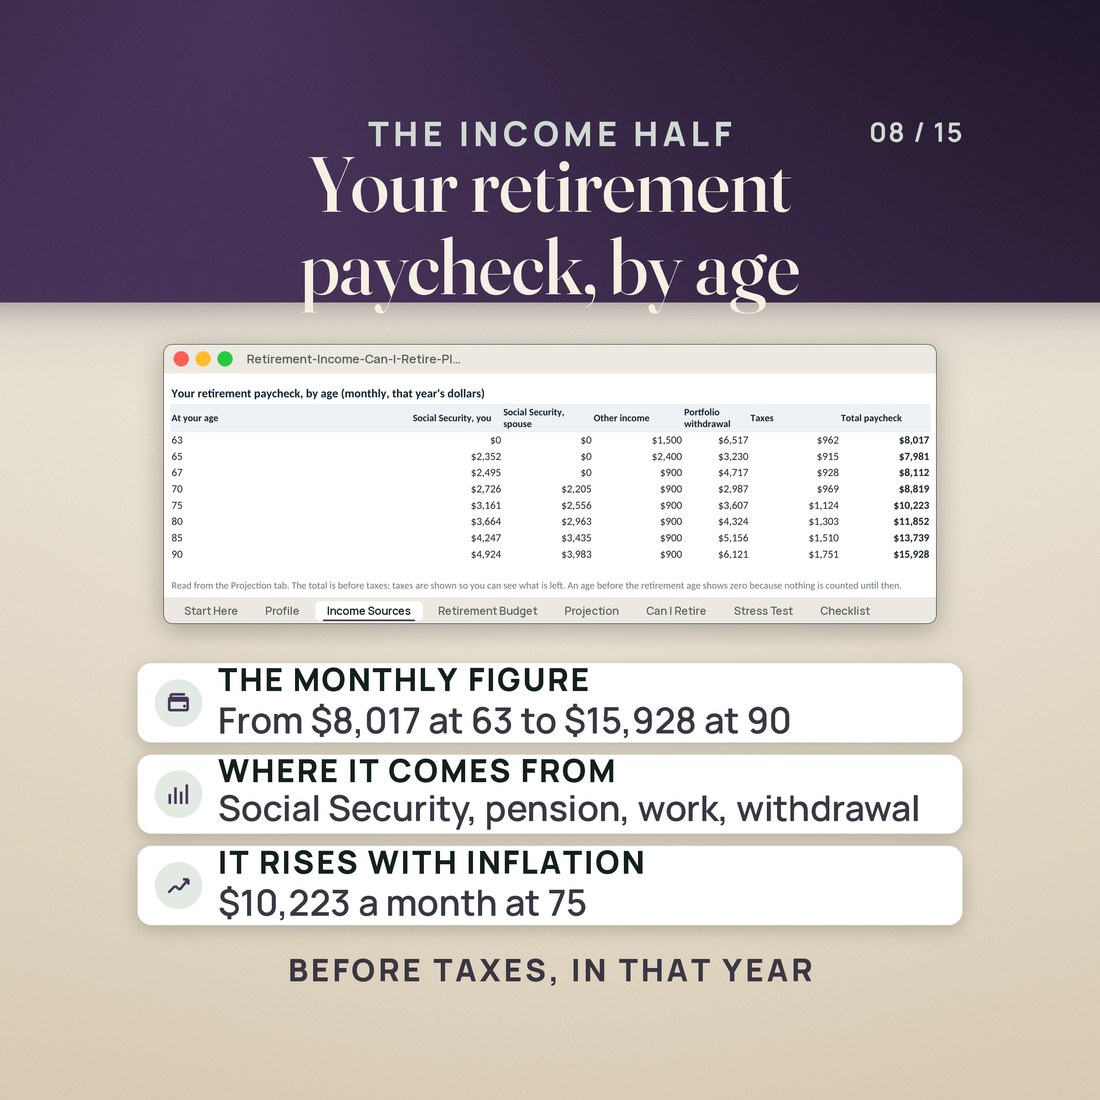
- A verdict on the age you type, with the paycheck beside it. At 63 the sample reads not yet, runs out at 88, $8,017.03 a month and a first-year withdrawal rate of 10.6%. At 65 it reads yes, lasts to 95, $7,981.25 a month, $372,728.69 left and a 4.4% rate. That is one cell
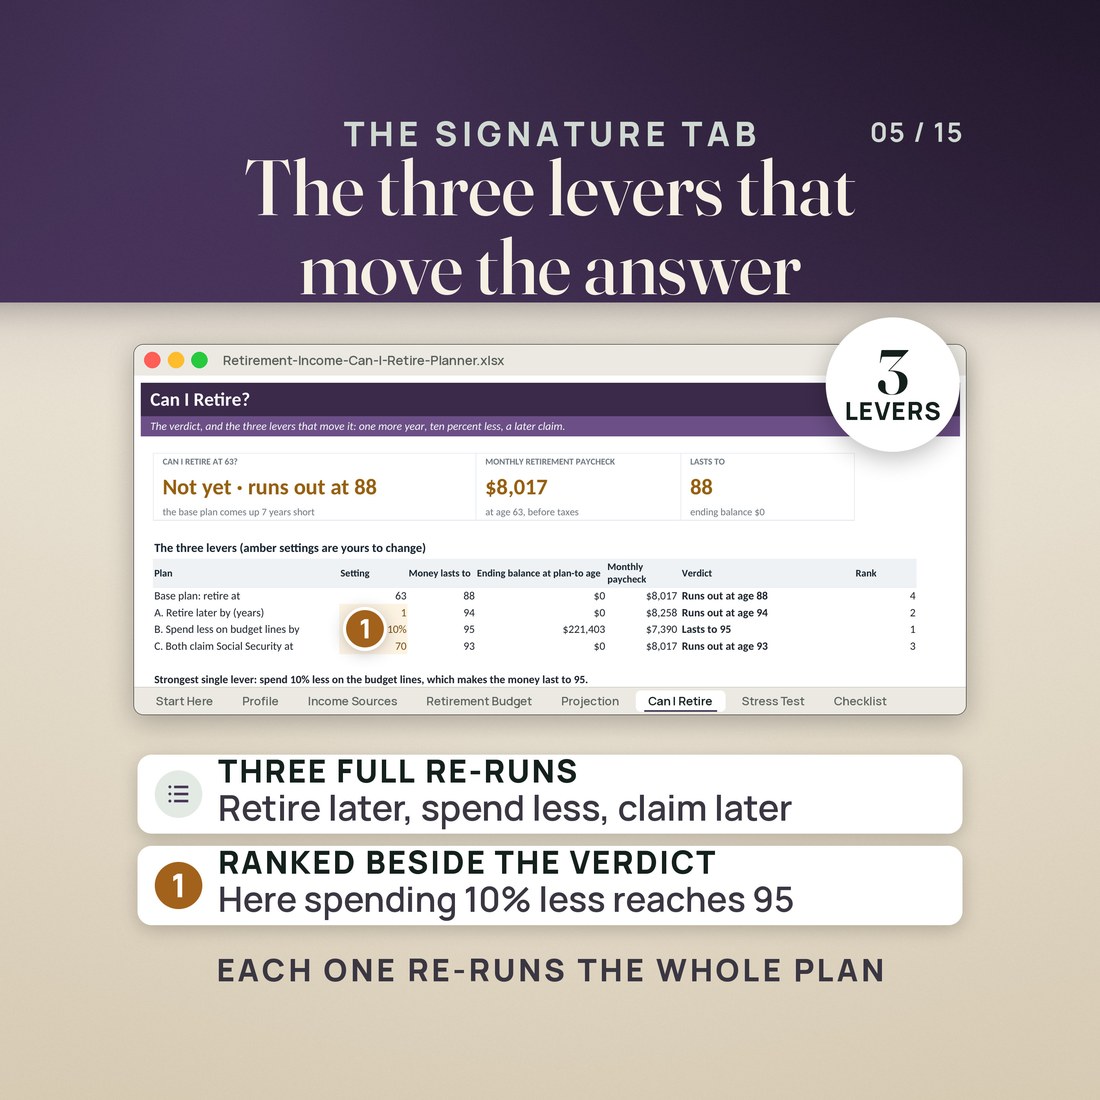
- Three levers, each one a complete re-run of your whole plan rather than a rule of thumb: retire one year later, spend 10% less on the budget lines, both claim Social Security at 70. Ranked 1 to 4, with the strongest named in a sentence
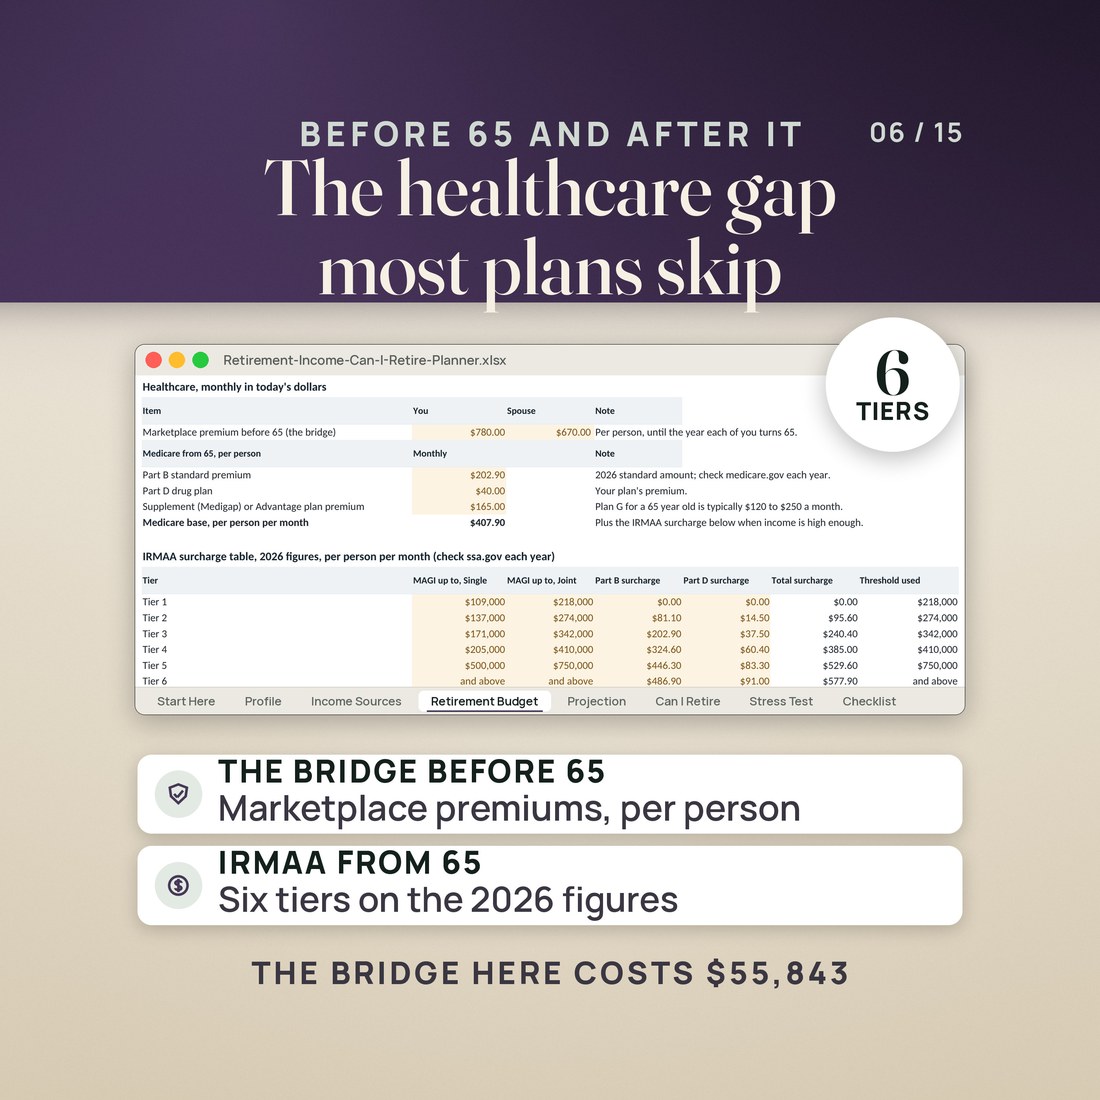
- The healthcare bridge before 65, priced: $55,843 of marketplace premiums retiring at 63 against $18,370 retiring at 65, then Part B, Part D and a supplement from 65 with the 2026 six-tier IRMAA surcharge looked up from your own projected income two years earlier
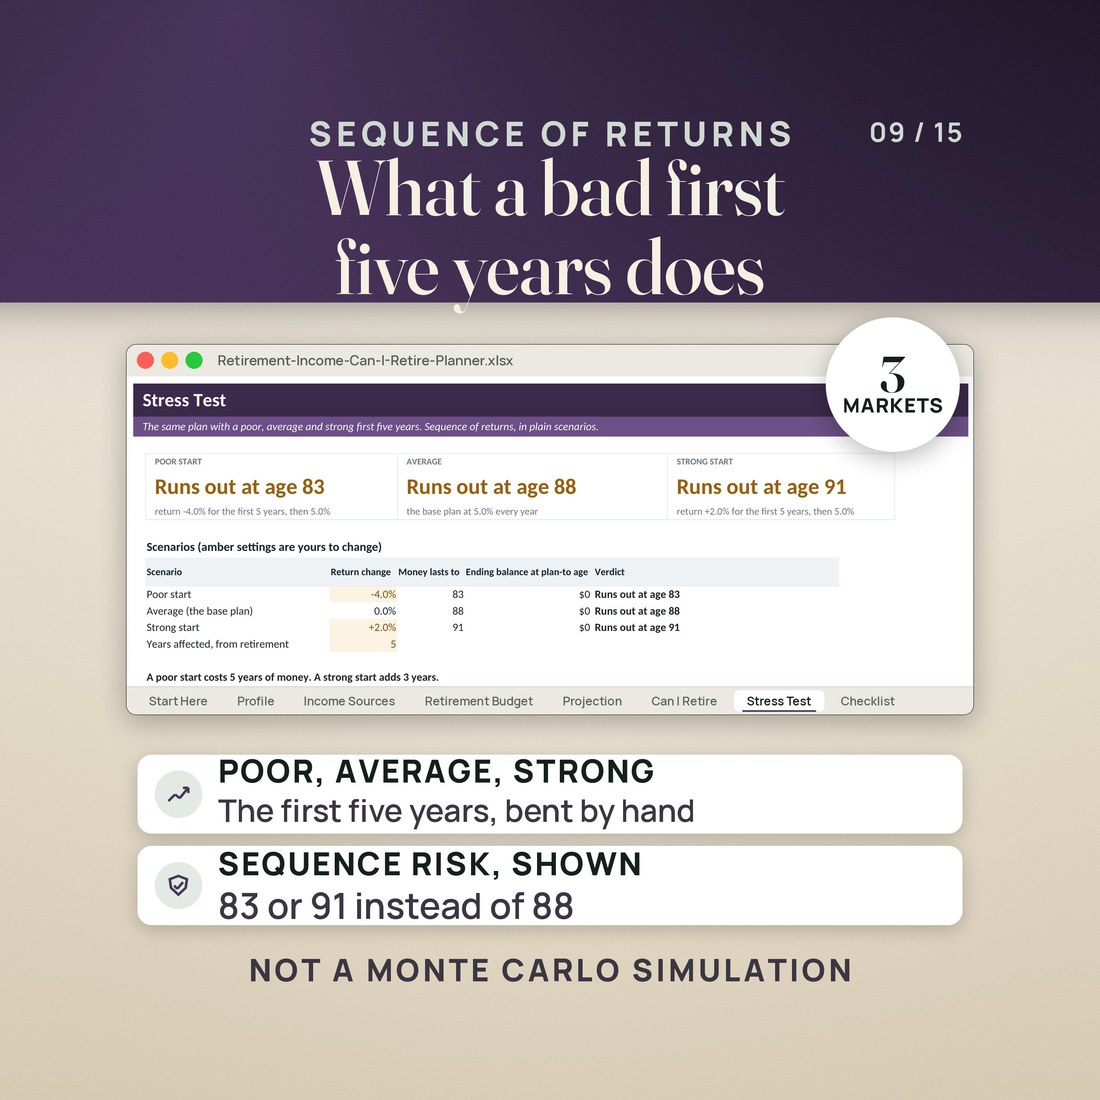
- A sequence of returns test in plain scenarios rather than a simulation: a poor first five years runs the sample out at 83, average at 88, strong at 91. Same money, same budget, a different first five years
- Two people in one plan. Two birth dates, two benefits at full retirement age and two claiming ages from 62 to 70, with the second person's Medicare and Social Security switching on at their own age
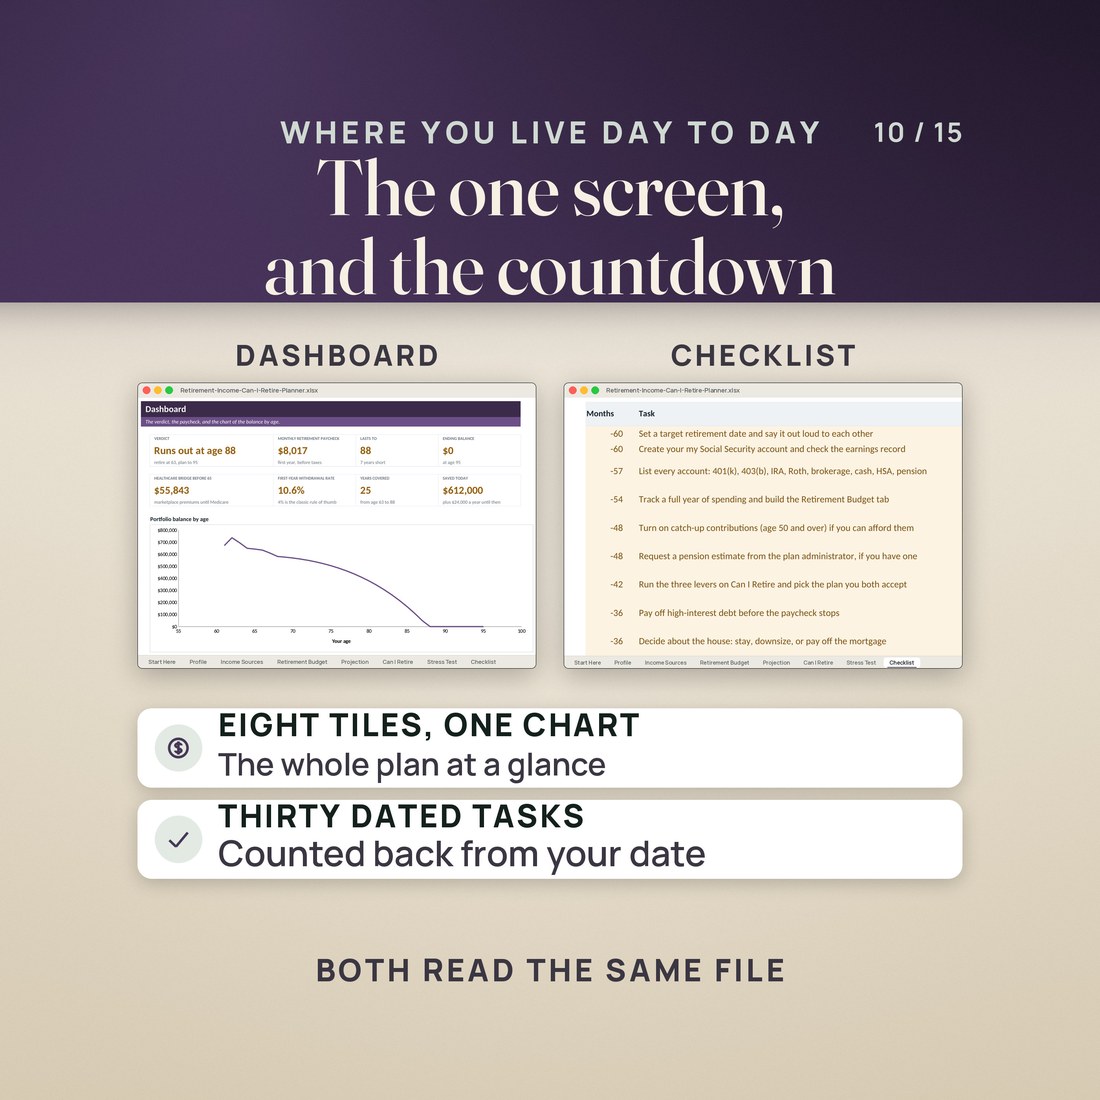
- Thirty pre-retirement tasks dated backward from the retirement date you settle on, with done boxes, a status and an open flag
- 6,885 formulas in every edition and eight complete projections running at once (your plan, the three levers, the three markets), recalculated with zero errors in Excel and in Google Sheets
- Four color editions of the same workbook: Colorful, Editorial, Light and Dark
Overview
Type the age you have in mind and the file answers in one line: yes or not yet, the age the money runs out, and the monthly retirement paycheck. Then it shows you what to change.
You have a number saved and an age in mind, and nothing that puts the two together. A readiness score out of 100 does not tell you what to change, and neither does a black box that runs a thousand simulations and hands back one probability of success.
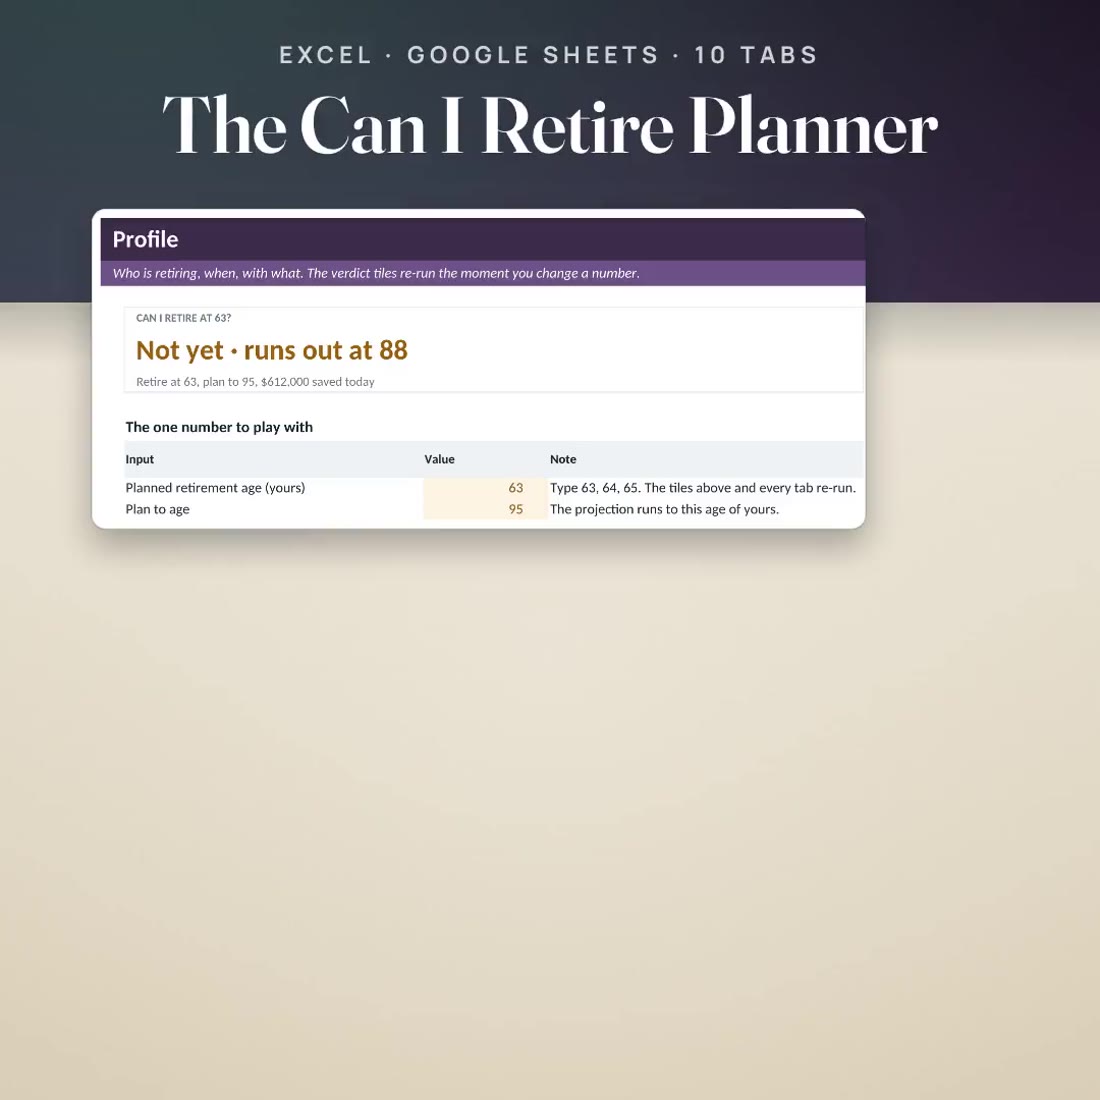
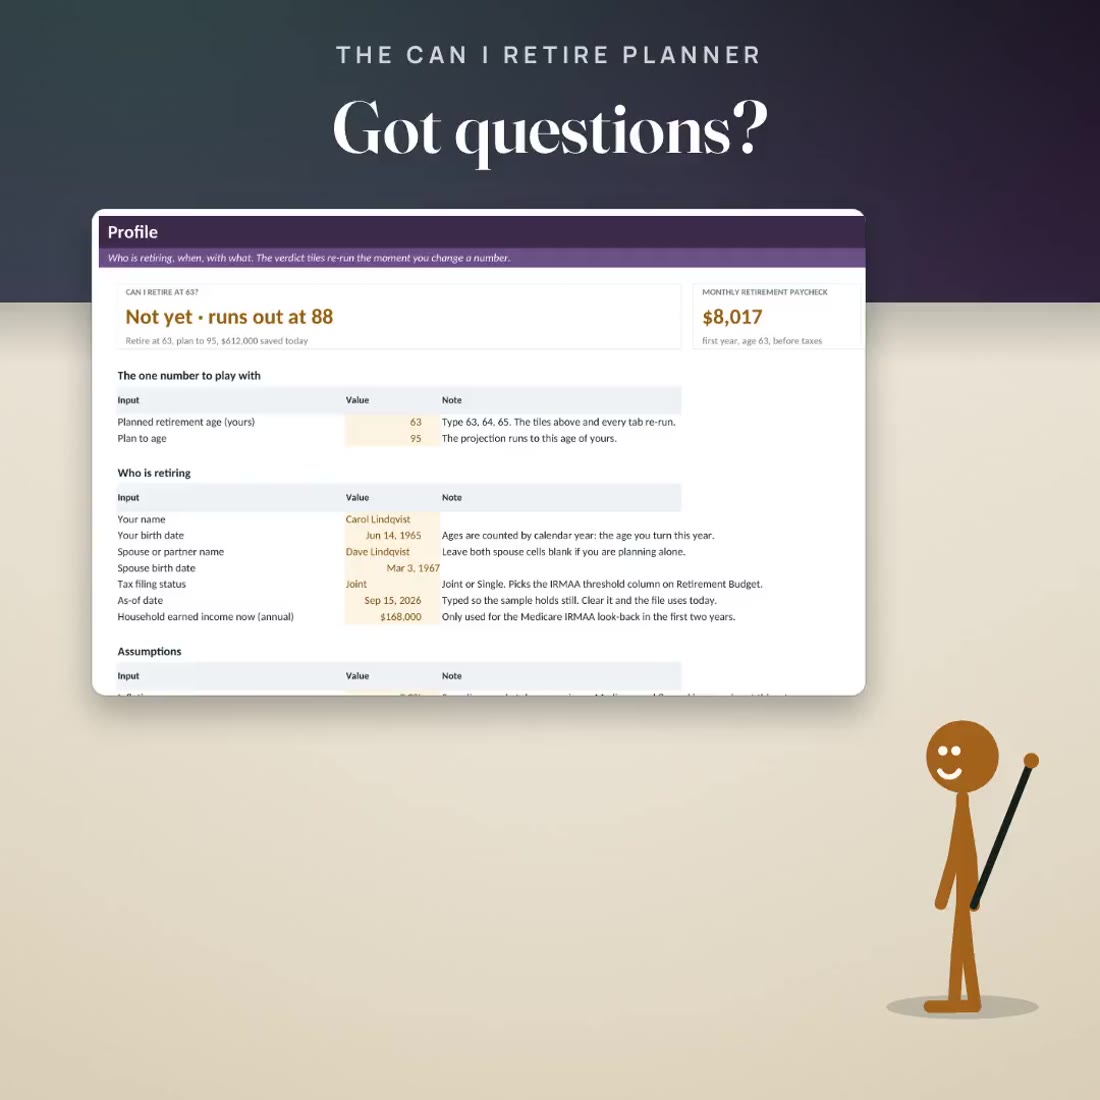
The sample this file opens with is a couple of 61 and 59 with $612,000 saved who would like to stop at 63, and the file answers in one line: not yet, runs out at 88, on a monthly retirement paycheck of $8,017.03 before taxes. Change the retirement age from 63 to 65 and the same file says yes, lasts to 95, with $372,728.69 still there at 95 and the healthcare bridge before Medicare down from $55,843 to $18,370. Then it shows you the three levers that move the answer, and what a bad first five years in the market would do to it.
What's Included
One ZIP, 6 files:
- One ZIP holding the Retirement Income and Can I Retire Planner as a single .xlsx workbook in four color editions: Colorful and Editorial loose, Light and Dark inside a small 3color zip beside them
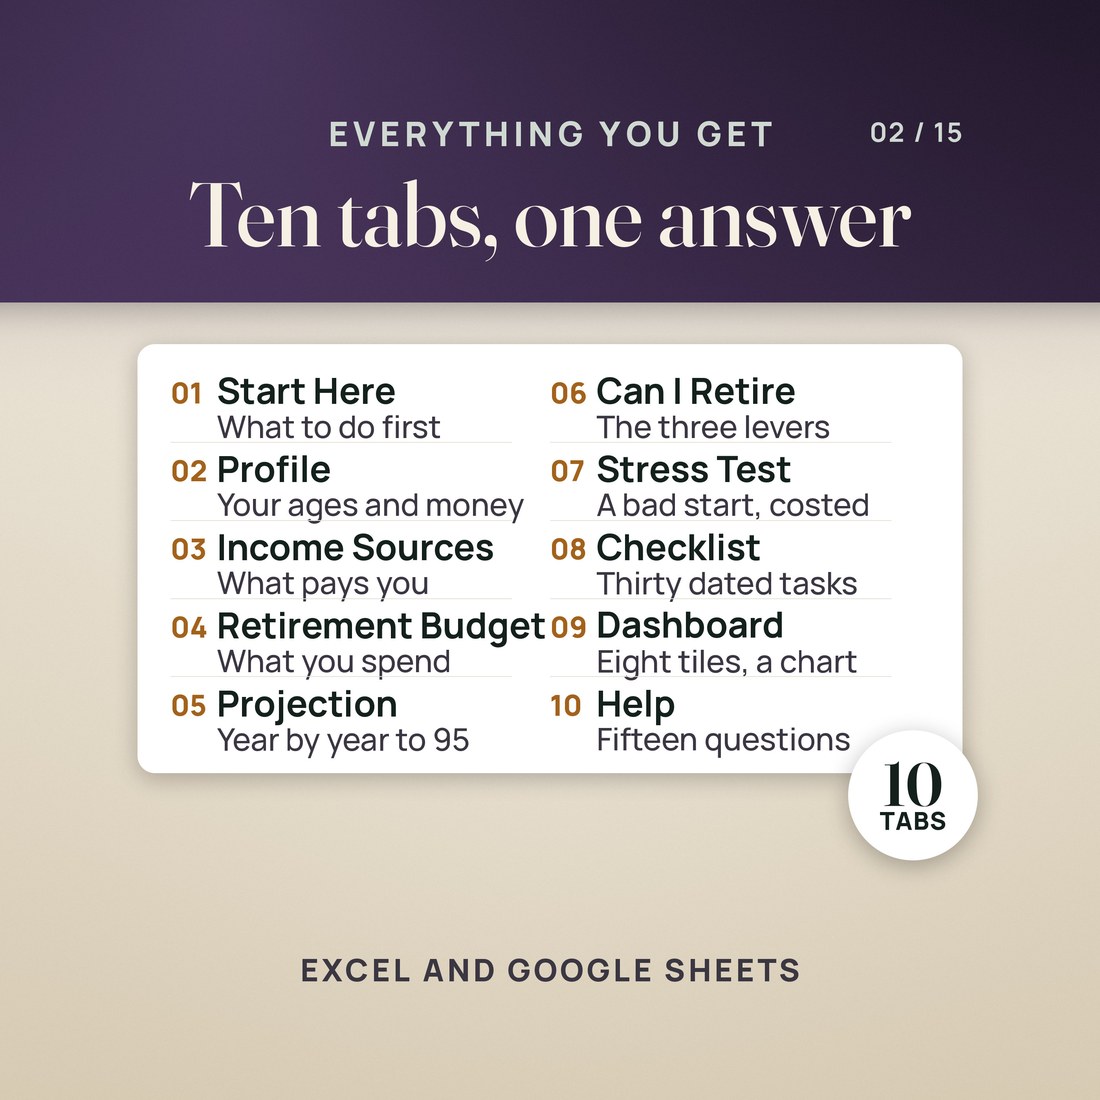
- Ten tabs: Start Here, Profile, Income Sources, Retirement Budget, Projection, Can I Retire, Stress Test, Checklist, Dashboard and Help
- A worked sample of an invented couple, Carol and Dave Lindqvist at 61 and 59 with $612,000 saved, already typed in so nothing opens blank
- A two page Quick-Start PDF and a START-HERE file with the four things to do first and the honest warnings
Key Benefits
Why this one
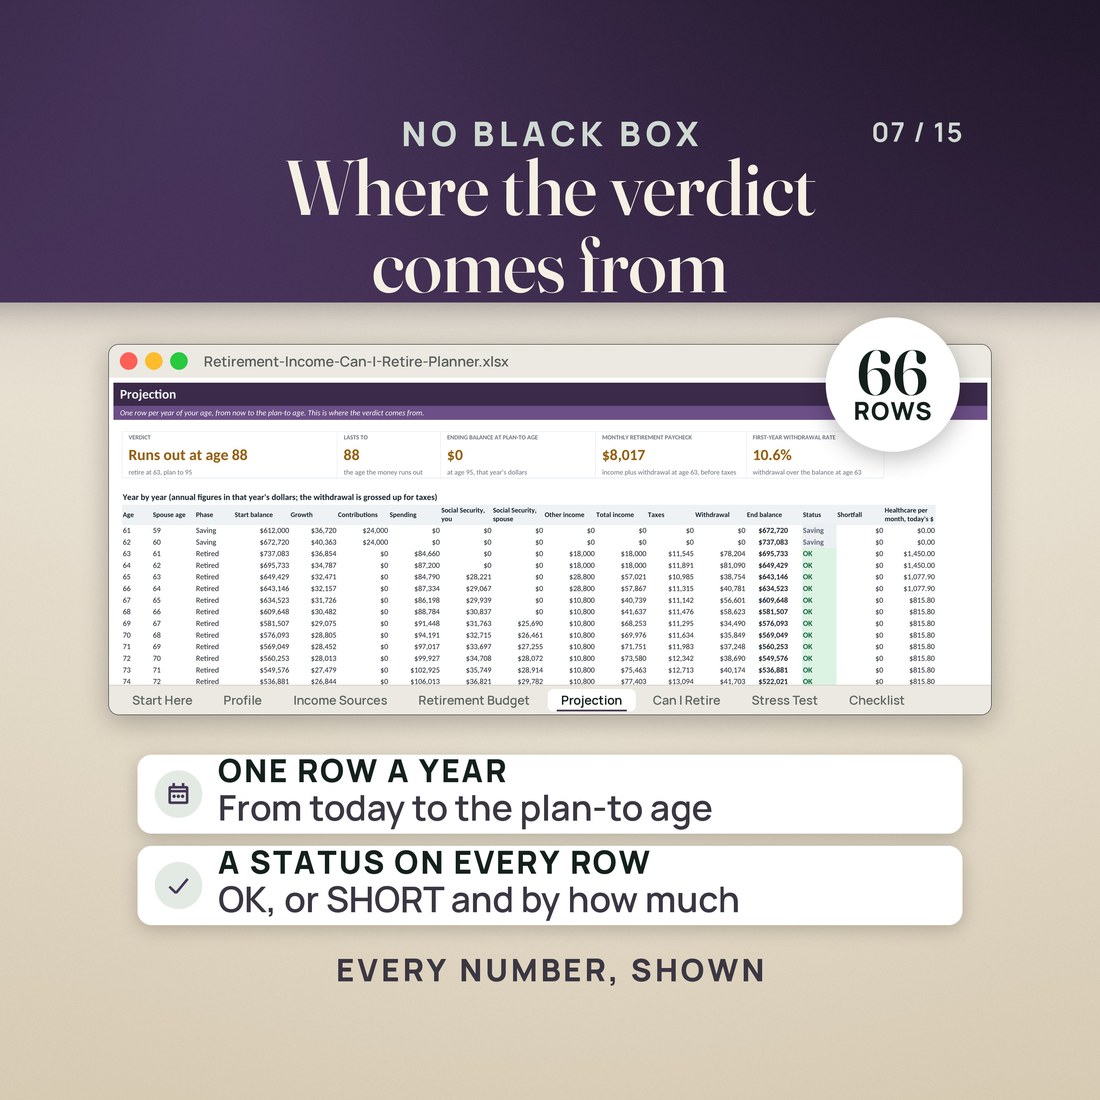
Not a score out of 100 and not a probability of success. Profile says can I retire at 63, answers not yet, runs out at 88, and every figure that produced the answer is on a tab you can read: the year-by-year projection, the withdrawal, the tax, the healthcare and the ending balance.
When the answer is not yet, three complete re-runs of your own plan sit beside the original: one more year of work reaches 94, spending 10% less reaches 95 with $221,403 left over, and both claiming at 70 reaches 93. The file ranks all four.
Retiring before 65 means buying your own cover, and it is the line most plans skip. Marketplace premiums are costed per person per year up to 65, then Part B, Part D and a supplement take over, with the IRMAA surcharge read off your own projected income two years earlier.
Sequence of returns risk is the thing that quietly ends a plan. Stress Test runs the same money and the same budget with a poor, an average and a strong first five years, side by side, and says what the bad start costs in years.
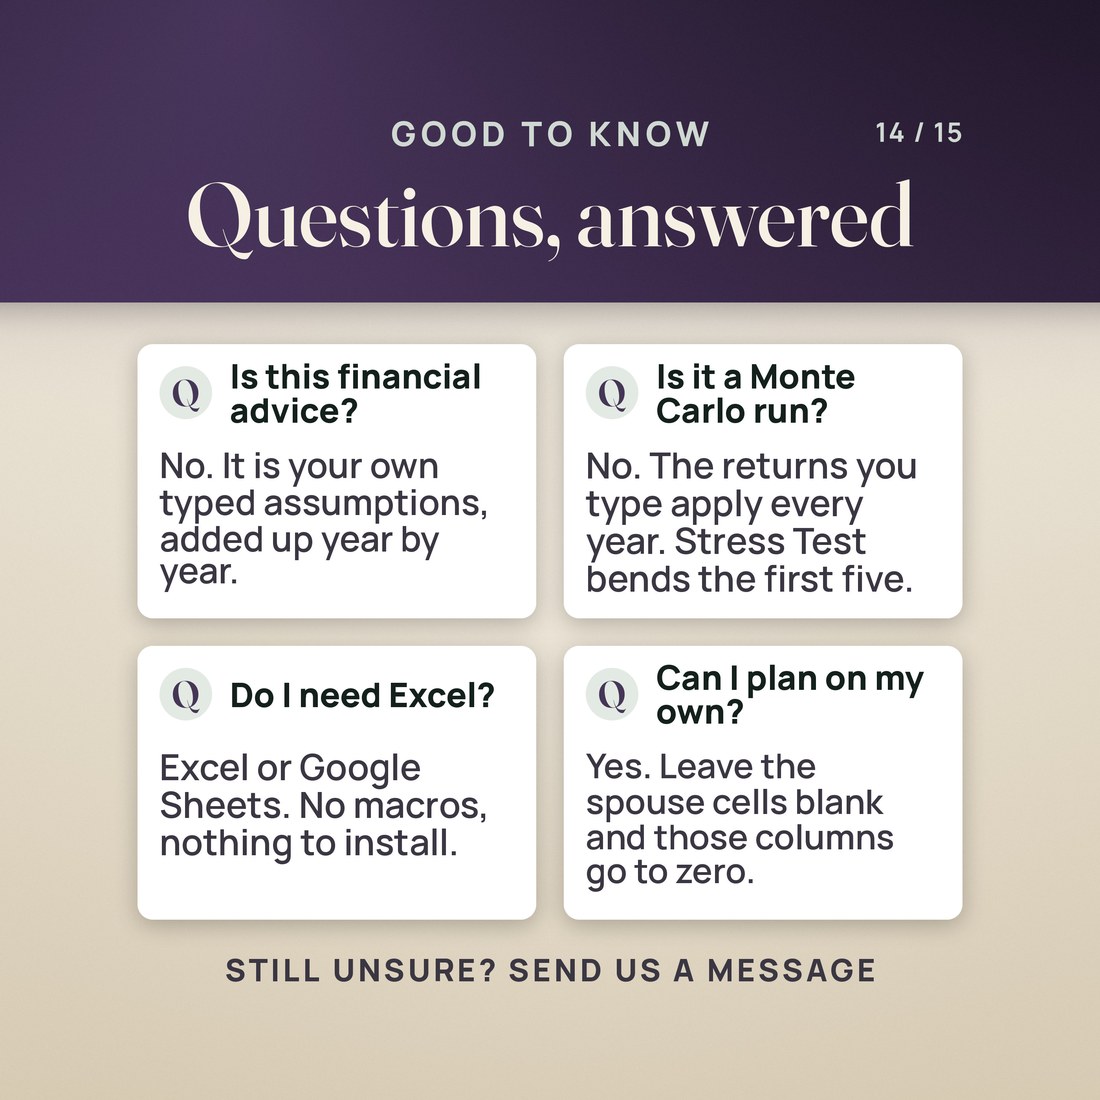
It is not a Monte Carlo simulation and it is not advice. Returns and inflation are constants you choose, applied every year. Required minimum distributions, Roth conversions, capital gains rates and state rules are not modelled, and long-term care is not modelled at all, which the Checklist says out loud.
Who It's For
Built for
- Someone within a few years of the age they have in mind who wants a straight answer and wants to see the arithmetic it came out of, not a score and not a black box
- A couple with two birth years, two benefits and two claiming ages who need one plan instead of two calculators
- Someone planning to stop before 65, who needs the years of marketplace premiums before Medicare priced into the plan and the IRMAA surcharge after it
- Anyone who has been told to just save more and wants to see, in years, what one more year of work or 10% less spending would actually buy them
How It Works
Up and running in minutes
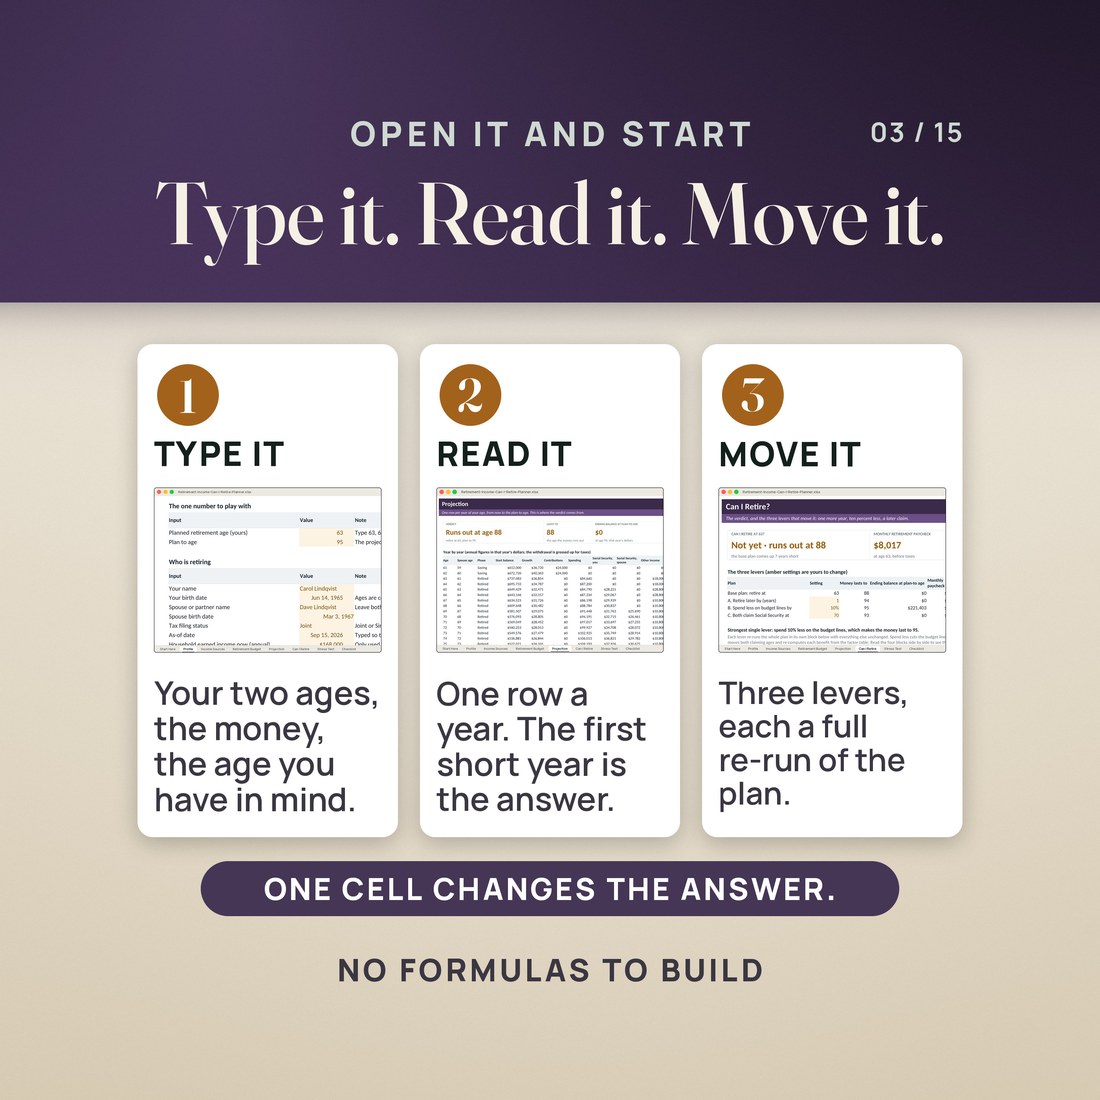
On Profile: two birth dates, the retirement age you have in mind, the plan-to age, inflation, the return before and after you retire, four balances and what you are still contributing.
Income Sources takes each benefit at full retirement age and the claiming age you want from 62 to 70, plus pension, annuity, rental or part-time work with start and stop ages. Retirement Budget takes eighteen category rows, the premiums and one effective tax rate.
The verdict, the monthly retirement paycheck and the age it lasts to, all at the top of Profile, all moving while you type. Change the retirement age by one cell and the whole file re-runs.
When it reads not yet, Can I Retire re-runs your plan three more ways and ranks them, Stress Test bends the first five years, and the Checklist dates thirty tasks backward from the date you settle on.
Why It's Different
Not another template
Retirement calculators come in two shapes and both of them dodge the question. One hands back a readiness score that does not tell you what to change. The other runs a thousand simulations and hands back a probability of success, which is a number you cannot act on either. This one answers in a sentence, shows the year-by-year arithmetic that produced it, and then re-runs your entire plan three more ways so the fix is a ranked list rather than a feeling. It also prices the two things most planners leave out: the years of marketplace premiums between retiring and Medicare, and the IRMAA surcharge that lands two years after the income that caused it.
Delivery & Compatibility
Instant, and it opens in what you already use
As soon as your order is complete you get instant access to download the ZIP: the workbook in four color editions, a two page Quick-Start PDF and a START-HERE file. Nothing ships and nothing installs.
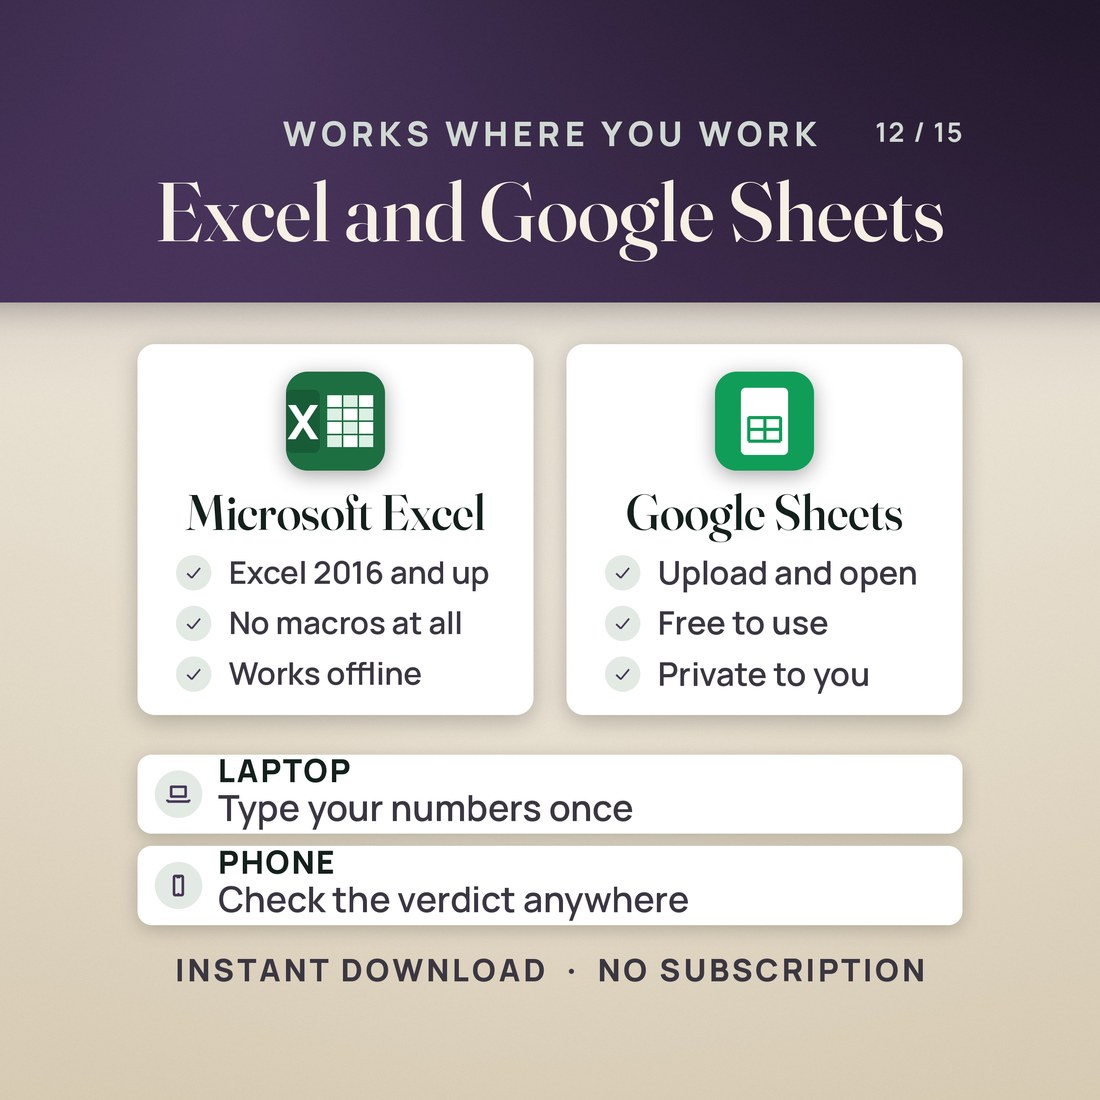
One ZIP, instant download. Built for Excel 2016 or later and tested in LibreOffice Calc; for Google Sheets choose File, Import, Upload, then Replace spreadsheet. Every formula ships with its value saved, so the sample shows up in protected view, in the Sheets preview and on a phone instead of blanks. Apple Numbers opens the file but drops some formatting. No macros, no add-ons, no account and no subscription.
FAQ
Questions, answered
What format is this?
One workbook (.xlsx) in four color editions, Colorful, Editorial, Light and Dark, plus a two page Quick-Start PDF and a plain text START-HERE file. You get a ZIP to download the moment payment clears.
What do I need to open it?
Excel 2016 or later, or Google Sheets (File, Import, Upload, then Replace spreadsheet), on a computer or through the Excel or Sheets app on a phone or tablet. It was tested in LibreOffice Calc as well. There are no macros, no add-ons and nothing to install.
What does it compute?
Whether the money lasts to your plan-to age or the age it runs out; your monthly retirement paycheck in the first retirement year and every year after; the first-year withdrawal rate; Social Security for each of you from the claiming age you pick using the factor table from 62 to 70; every other income source between its start and stop ages; spending inflated year by year with healthcare split into marketplace premiums before 65 and Medicare with an IRMAA surcharge after it; the withdrawal each year, grossed up so spending plus tax is met; the ending balance at your plan-to age; the run-out age under three levers and three market scenarios; and thirty checklist dates.
Is this a Monte Carlo simulation?
No, and it does not pretend to be. The return and the inflation you type apply every single year. Stress Test bends the first five years by an amount you choose in three plain scenarios instead, so you can see what a bad start costs in years. None of the three is a prediction.
Are the Medicare and Social Security figures kept up to date?
No. The 2026 IRMAA brackets and surcharges, the Part B, Part D and supplement premiums and the claiming factors from 62 to 70 are amber inputs holding 2026 figures, and nothing in the file updates them. Check them against ssa.gov and medicare.gov each year and retype them along with your own benefit at full retirement age.
Is this financial advice?
No. It is a spreadsheet doing arithmetic on assumptions you type, and the verdict is that arithmetic and nothing more. Every name and figure in the sample, including Carol and Dave Lindqvist, was invented for the example. Talk to a professional about your own situation.
Nothing in this file is financial, tax, legal or Medicare advice. Returns and inflation are constants you choose, applied every single year; real markets do not behave that way and this is not a forecast. Tax is one effective rate you type, and required minimum distributions, Roth conversions, capital gains rates, the standard deduction and state rules are not modelled; the four balances are treated as one pot. Everything lands once a year rather than once a month, so the ages are right to the year and the balances are not right to the month. A surplus year is treated as spent rather than reinvested, which is conservative on purpose. Long-term care is not modelled at all, and it is the largest single risk a plan like this misses. The four color editions are separate files, so a figure typed into Light does not appear in Dark. Every name and figure in the sample was invented for the example. Digital product; because the files are delivered instantly, all sales are final.